SPSS软件——社会科学统计软件包

利用数据分析解决严峻的业务和研究挑战

IBM SPSS Statistics 是集成的系列产品,有助于应对整个分析流程,从规划和数据收集到分析、报告和部署。提供数十种完全集成的模块供您选择,您可以找到增加收入、超越竞争对手和改善决策所需的专业化的功能。

IBM SPSS Statistics Standard: 适用于各种业务和研究问题的基本分析功能

适用于各种业务和研究问题的基本分析功能
IBM SPSS Statistics Standard Edition 为业务经理和分析人员提供解决基本业务和研究问题所需的核心统计程序。该软件提供的工具使用户能够快速查看数据、为其他测试拟定假设情况、执行程序来澄清各个变量之间的关系、创建类群、发现趋势和进行预测。
IBM SPSS Statistics Standard Edition 包含以下主要功能:
  • 线性模型提供各种回归和高级统计程序,旨在适应描述复杂关系的数据的固有特征。
  • 非线性模型能够将较为复杂的模型应用于数据。
  • 地理空间分析技术支持用户对位置和时间数据进行集成、探索和建模。
  • 模拟功能帮助分析人员自动模拟许多可能的结果(输入不确定时),同时改进风险分析和决策制定。
  • 定制表使用户能够轻松理解其数据,并针对不同受众以不同风格快速汇总结果。

IBM SPSS Statistics Professional: 用于应对整个分析生命周期内挑战的工具。

IBM SPSS Statistics Professional Edition 除了包含 Standard Edition 中提供的核心统计功能外,还提供了用于解决数据质量、数据复杂性、自动化和预测问题的功能。它能够使数据准备自动化,专为执行各种非标准深入分析且需要节省时间的用户而设计。
IBM SPSS Statistics Professional Edition 包含以下主要功能:
  • 线性模型提供各种回归和高级统计程序,旨在适应描述复杂关系的数据的固有特征。
  • 非线性模型能够将较为复杂的模型应用于数据。
  • 地理空间分析支持用户对位置和时间数据进行集成、探索和建模。
  • 模拟功能帮助分析人员自动模拟许多可能的结果(输入不确定时),同时改进风险分析和决策制定。

  • 定制表使用户能够轻松理解其数据,并针对不同受众以不同风格快速汇总结果。
  • 数据准备简化了分析过程的数据准备阶段。
  • 数据有效性和缺失值检查提升了获得有显著统计意义结果的几率。
  • 决策树可更方便地标识组、发现各个组之间的关系和预测未来事件。
  • 预测功能帮助您更快地分析历史数据并预测趋势。

IBM SPSS Statistics Premium: 集所有功能于一身的版本,专为有多种高级分析需求的大型企业而设计。

IBM SPSS Statistics Premium Edition 帮助数据分析人员、规划人员、预测人员、调查研究人员、程序评估人员及数据库营销人员等在分析过程的每个阶段轻松地完成任务。它完全集成了 Statistics 功能,以及用于整个企业内各种专门的分析任务的相关产品。该软件能够显著提高生产力,有助于特定项目和业务目标取得出色成果。
IBM SPSS Statistics Premium Edition 包括以下功能:
  • 线性模型提供各种回归和高级统计程序,旨在适应描述复杂关系的数据的固有特征。
  • 非线性模型能够将较为复杂的模型应用于数据。
  • 地理空间分析支持用户对位置和时间数据进行集成、探索和建模。
  • 模拟功能帮助分析人员自动模拟许多可能的结果(输入不确定时),同时改进风险分析和决策制定。
  • 定制表使用户能够轻松理解其数据,并针对不同受众以不同风格快速汇总结果。
  • 数据准备简化了分析过程的数据准备阶段。
  • 数据有效性和缺失值检查提升了获得有显著统计意义结果的几率。
  • 分类数据和数字数据可用于预测结果并以图形方式显示关系。

  • 决策树可更方便地标识组、发现各个组之间的关系和预测未来事件。
  • 预测功能帮助您更快地分析历史数据并预测趋势。
  • 结构方程式建模工具使您能够以更准确的方式构建结构方程式模型,比使用直观的拖放功能设计的标准多变量统计模型更准确。
  • 引导程序简化了对模型稳定性和可靠性的测试,使生成的结果更加准确可靠。
  • 高级采样评估和测试通过将样本设计整合到调查分析中,生成从统计意义而言更为有效的推论。
  • 直接市场营销和产品决策工具可帮助市场营销人员更轻松地发现适合的客户,提升营销活动效果。
  • 高端图表(High-end charts)使用户可以在一系列平台和智能设备上方便地创建和共享吸引人的可视化效果,并与之进行交互。

IBM SPSS Amos

轻松执行结构方程式建模

IBM SPSS Amos 支持您通过指定、估算、评估和呈现模型来显示变量之间的假定关系。与标准的多变量统计技术相比,该软件可以让您构建更准确的模型。用户可以选择图形用户界面,也可以使用非图形的程序化界面。

SPSS Amos 支持您构建态度模型和行为模型来反映复杂的关系。该软件:
  • 提供结构化的方程式建模 (SEM) - 易于使用,而且您可以方便地比较、确认和优化模型。
  • 使用贝叶斯算法分析 - 改进模型参数的估算。
  • 提供各种数据归因算法 - 创建不同的数据集。

拖放界面

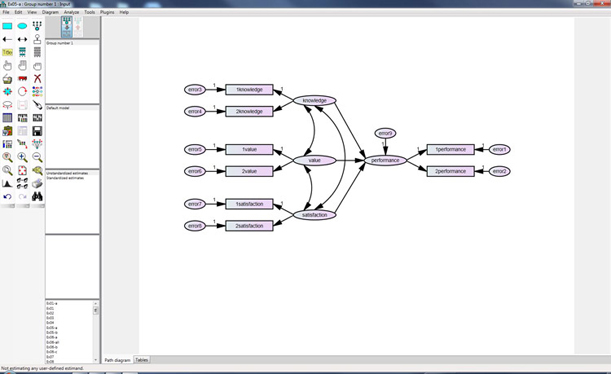
SPSS Amos 拖放用户界面帮助您以可视方式轻松构建结构方程模型。
导入数据

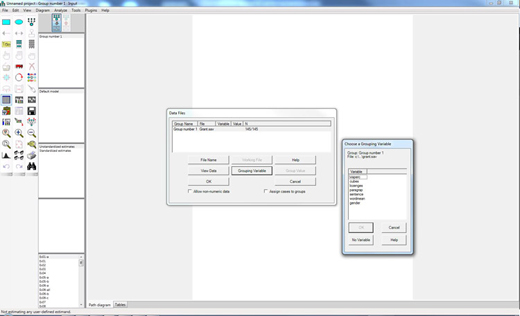
您可以轻松地导入 SPSS Statistics 数据文件,以便在 SPSS Amos 中进行分析。
查看输出

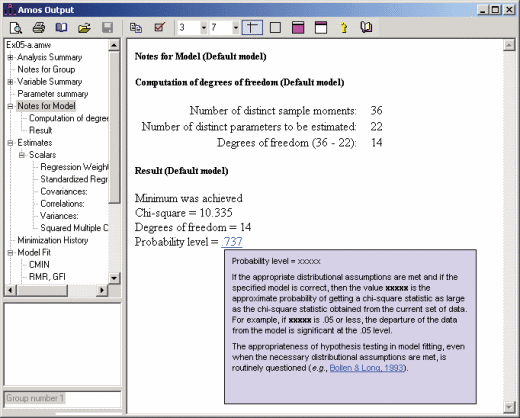
SPSS Amos 输出提供协方差和回归加权以及各种模型拟合测量(model fit measures)的标准化或非标准化评估。帮助系统中的热链接指向有关分析的简单英语解释。

提供 SEM

  • 使用拖放式绘图和编辑工具,快速构建图形模型。
  • 创建真实反映复杂关系的模型。
  • 使用任何数值(无论是观测变量还是潜变量)来预测任何其他数值。
  • 使用非图形脚本编制功能快速运行大型的复杂模型,并生成略有区别的类似模型。
  • 利用多变量分析扩展标准方法,例如,回归、因子分析、差异的关联和分析。

使用贝叶斯算法分析

  • 通过指定内容丰富的先验分布,改进估算。
  • 利用可自动调整的底层“马尔可夫链蒙特卡尔理论 (Markov chain Monte Carlo, MCMC)”计算方法。
  • 以有序的分类数据和审查数据执行估算。
  • 使用简化的方法,指定用户定义的估算。
  • 基于非数字数据创建模型,而无需将数字分数分配给数据。
  • 使用审查数据,而无需进行除正常情况之外的假定。

提供各种数据归因方法

  • 使用回归归因创建单一完整的数据集。
  • 使用随机回归归因或贝叶斯算法归因创建多个归因的数据集。
  • 您还可以归因缺失值或潜在变量分数。

IBM SPSS Statistics不同产品包所包含的产品说明

SPSS Statistics Standard统计分析标准产品包 SPSS Statistics Professional 统计分析专业产品包 SPSS Statistics Premium 全模块统计分析产品包 产品介绍
Base Base Base 必需的基础模块,管理整个软件平台,管理数据访问、数据处理和输出,并能进行很多种常见基本统计分析。基本统计分析功能包括描述统计和行列计算,还包括在基本分析中最受欢迎的常见统计功能,如汇总、计数、交叉分析、分类比较、描述性统计、因子分析、回归分析及聚类分析等等。
Advanced Statistics Advanced Statistics Advanced Statistics 在分析数据时,除了基本的数据分析外,如果还想建立分析过程数据,就需要使用Advanced Models,为顺序结果建立更灵活、更成熟的模型,在处理嵌套数据时得到更精确的预测模型,可以分析事件历史和持续 时间数据。具体功能包括:广义线性模型(GZLMS)、广义估计方程(GEES)、混合模型、一般线性模型(GLM)、方差成分估计、MANOVA、Kaplan-Meire 估计、Cox 回归、多因子系统模式的对数线性模型、对数线性模型、生存分析。
Regression Regression Regression 大量的非线性建模工具、多维尺度分析帮助研究人员进行非线性回归分析。它将数据从数据约束中解放出来,方便地把数据分成两组,建立可控制的模型及表达式进行非线性模型的参数估计,能够建立比简单线性回归模型更好的预测模型。
Custom Tables Custom Tables Custom Tables 提供35 种单元和摘要统计量,能够更方便地显示多重序列数据,它能串接所有的维度,以在同一表格中显示包含不同统计量的各种变量。Tables 用更深入的分析,轻松地处理复选题与缺失值,用包括所有统计量、易于理解的表格来展现分析结果,通过完整的表格控制权,研究人员还可以自制表格,创造优美外观。

Data Preparation Data Preparation 大量的非线性建模工具、多维尺度分析帮助研究人员进行非线性回归分析。它将数据从数据约束中解放出来,方便地把数据分成两组,建立可控制的模型及表达式进行非线性模型的参数估计,能够建立比简单线性回归模型更好的预测模型。

Missing Values Missing Values 缺失数据会带来偏差或错误的分析结果,简单代入法或者简单的回归法都不能正确地填补缺失值,Missing Values Analysis 帮助研究人员在分析过程中排除数据中隐含的偏差,得出更精确的结论。Missing Values Analysis 用六种灵活的诊断报告来评估缺失值是否会影响分析结论,更好地了解它们的特性。

Forecasting Forecasting Forecasting 是目前功能最强的时间序列分析工具,是分析历史资料、建立模型与预测未来事件的强有力的工具,能帮助研究人员做更好的预测。Forecasting 利用完备的时间序列提高预测能力,包括多重曲线拟合、平滑以及自回归方程估计。

Categories Categories Categories 是优秀的对应分析程序,用启发性的二维图和感知图让您清晰地看到数据中的关系,使您可以更完整和方便地分析数据。Categories 提供非线性主成分分析来描述数据,并用图标清楚地展示数据中的关系,展示并分享动态、交互的分析结果,让您从分类数据中得到更丰富的信息。

Decision Trees Decision Trees Decision Trees 模块基于数据挖掘中发展起来的树结构模型对分类变量或连续变量进行预测,可以方便、快速的对样本进行细分。它可直接在PASW STATISTICS 内做分类区分,用Syntax 撰写或用XML 来储存设定。使用Classification Trees 还可建立决策树来确认分组并预测结果,利用直觉式的树形图,颜色分类图,和表格协助研究人员轻松确认和评估区隔。


Direct Marketin Direct Marketing 主要用来处理市场直销中的一些分析需求。目前提供RFM 客户评分,客户分群,目标客户轮廓概括,客户响应评分,不同营销行为响应测量等模型。将直销中常用的分析定制为不同的模块,市场研究人员可藉由Direct Marketing 模块,以简单的方式进行简易直觉的分析,锁定高价值顾客,来进行各种营销分析。


Complex Sample 如果使用了特别复杂的抽样方案,该模块可以计算复杂样本的统计数据,得到更精确的结果。它拥有专门的规划工具和统计方法,提供各种向导来制定取样方案或详细定义样本,并提供专门的技术来解决样本设计以及相伴标准误差,能够减少得出错误或误导性推论的风险。


Conjoint SPSS Conjoint 是包含三个相互关联过程的一个系统,用于进行全特征联合分析。联合分析使研究人员了解消费者的偏好,或在一定产品属性及其水平条件下的产品评定。联合分析考虑研究时应包括的产品属性、考虑属性水平、产品卡片的数量,用正交设计生成一个包含适量产品卡片的正交主效果片段因子设计。


Neural Networks 神经网络是一种模拟人类大脑处理信息的方式的简化算法模型。通过多个神经元层的输入输出运算给出一个判断结果


Bootstrapping Bootstrapping 模块可以让您更有效的使用小样本量的数据,通过数据自身重采用的功能,让用户可以模拟大样本情况下的采样结果,从而对数据结构特征和偏差有更直接的认识。

What is IBM SPSS?

What if you could get deeper, more meaningful insights from your data and predict what is likely to happen next? IBM SPSS predictive analytics software offers advanced techniques in an easy-to-use package to help you find new opportunities, improve efficiency and minimize risk.

Statistical analysis and reporting

Address the entire analytical process: planning, data collection, analysis, reporting, and deployment.

Predictive modeling and data mining

Use powerful model-building, evaluation, and automation capabilities.

Decision management and deployment

Activate your analytics with advanced model management and analytic decision management on prem, on cloud or as hybrid.

Big data analytics

Analyze big data to gain predictive insights and build effective business strategies.

IBM SPSS Statistics

Empower everyone from beginners to expert analysts to understand data, identify trends and produce accurate forecasts.

IBM SPSS Statistics Standard

Fundamental analytical capabilities for a range of business and research questions
The IBM SPSS Statistics Standard Edition offers the core statistical procedures business managers and analysts need to address fundamental business and research questions. This software provides tools that allow users to quickly view data, formulate hypotheses for additional testing, and carry out procedures to clarify relationships between variables, create clusters, identify trends and make predictions.
The IBM SPSS Statistics Standard edition includes the following key capabilities:
  • Linear models offer a variety of regression and advanced statistical procedures designed to fit the inherent characteristics of data describing complex relationships.
  • Nonlinear models provide the ability to apply more sophisticated models to data.
  • Geospatial analytics techniques enable users to integrate, explore and model location and time data.
  • Simulation capabilities help analysts automatically model many possible outcomes when inputs are uncertain, improving risk analysis and decision making.
  • Customized tables enable users to easily understand their data and quickly summarize results in different styles for different audiences.

IBM SPSS Statistics Professional

Tools to address the challenges of the entire analytic lifecycle
The IBM SPSS Statistics Professional Edition goes beyond the core statistical capabilities offered in the Standard Edition to address issues of data quality, data complexity, automation and forecasting. It is designed for users who perform many types of in-depth and non-standard analyses and who need to save time by automating data preparation tasks.
The IBM SPSS Statistics Professional edition includes the following key capabilities:
  • Linear models offer a variety of regression and advanced statistical procedures designed to fit the inherent characteristics of data describing complex relationships.
  • Nonlinear models provide the ability to apply more sophisticated models to data.
  • Geospatial analytics enables users to integrate, explore and model location and time data.
  • Simulation capabilities help analysts automatically model many possible outcomes when inputs are uncertain, improving risk analysis and decision making.

  • Customized tables enable users to easily understand their data and quickly summarize results in different styles for different audiences.
  • Data preparation streamlines the data preparation stage of the analytical process.
  • Data validity and missing values increase the chance of receiving statistically significant results.
  • Decision trees make it easier to identify groups, discover relationships between groups and predict future events.
  • Forecasting features enable you to analyze historical data and predict trends faster.

IBM SPSS Statistics Premium

An all-in-one edition for enterprise businesses with multiple advanced analytics requirements

The IBM SPSS Statistics Premium Edition helps data analysts, planners, forecasters, survey researchers, program evaluators and database marketers – among others – to easily accomplish tasks at every phase of the analytical process. It includes a broad array of fully integrated Statistics capabilities and related products for specialized analytical tasks across the enterprise. The software will improve productivity significantly and help achieve superior results for specific projects and business goals.
The IBM SPSS Statistics Premium Edition includes the following capabilities:
  • Linear models offer a variety of regression and advanced statistical procedures designed to fit the inherent characteristics of data describing complex relationships.
  • Nonlinear models provide the ability to apply more sophisticated models to data.
  • Geospatial analytics enables users to integrate, explore and model location and time data.
  • Simulation capabilities help analysts automatically model many possible outcomes when inputs are uncertain, improving risk analysis and decision making.
  • Customized tables enable users to easily understand their data and quickly summarize results in different styles for different audiences.
  • Data preparation streamlines the data preparation stage of the analytical process.
  • Data validity and missing values increase the chance of receiving statistically significant results.
  • Categorical and numeric data can be used to predict outcomes and reveal relationships graphically.

  • Decision trees make it easier to identify groups, discover relationships between groups and predict future events.
  • Forecasting features enable you to analyze historical data and predict trends faster.
  • Structural equation modeling tools let you build structural equation models with more accuracy than standard multivariate statistics models using intuitive drag-and-drop functionality.
  • Bootstrapping makes it simple to test the stability and reliability of models so that they produce accurate, reliable results.
  • Advanced sampling assessment and testing helps make more statistically valid inferences by incorporating the sample design into survey analysis.
  • Direct marketing and product decision-making tools help marketers identify the right customers easily and improve campaign results.
  • High-end charts and graphs make it easy to create and share and interact with compelling visualizations results on a range of platforms and smart devices.